Quantitative phase
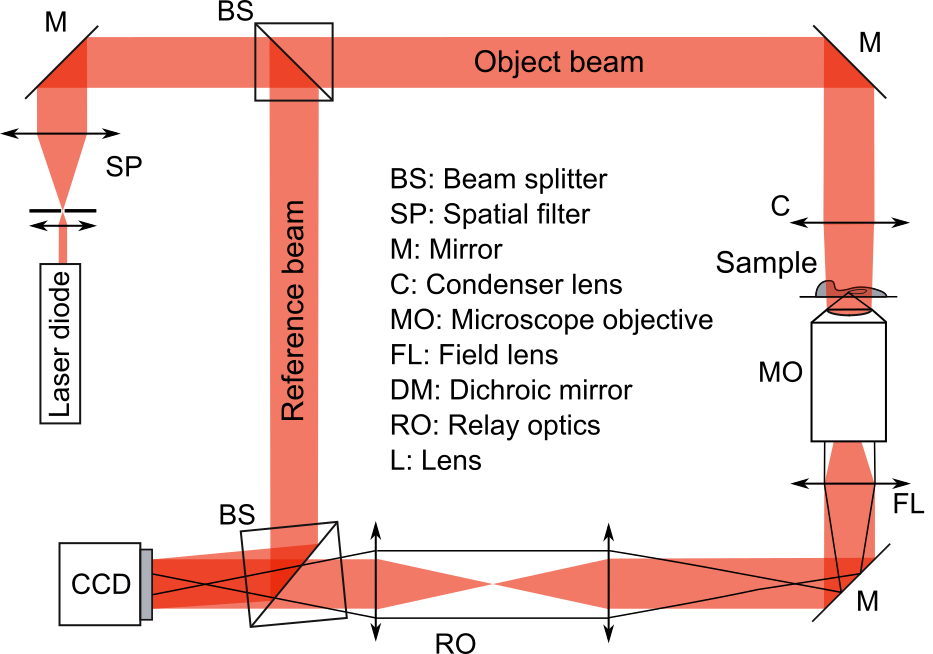
Optical schematics of an off-axis digital holographic setup.
Quantitative phase microscopy (QPM) is an approach to image transparent object such as cells that has been developed in the past few decades. Phase contrast has historically been one of the first imaging method, such as the well known Zernike phase contrast of differential interference microscopy. QPM is different from these methods as it provides quantitative information, where each pixel is proportional to the refractive index throughout the height of the sample. This provides images without the classical artefacts present in classical methods (such as halos in phase contrast or directional gradients in DIC).
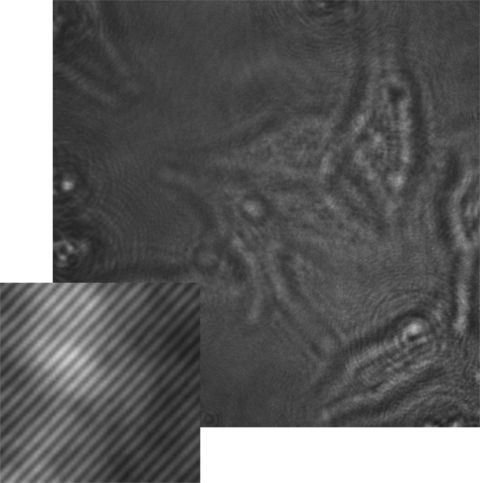
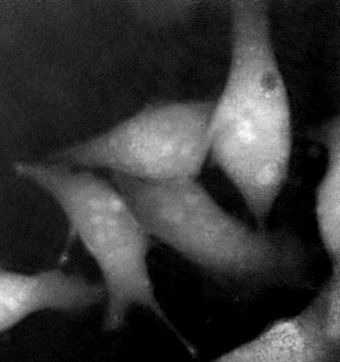
(left) Typical hologram, where the high frequency fringes that contain the phase information can be seen. (right) Resulting quantitative phase image of HeLa cells, showing the local optical density.
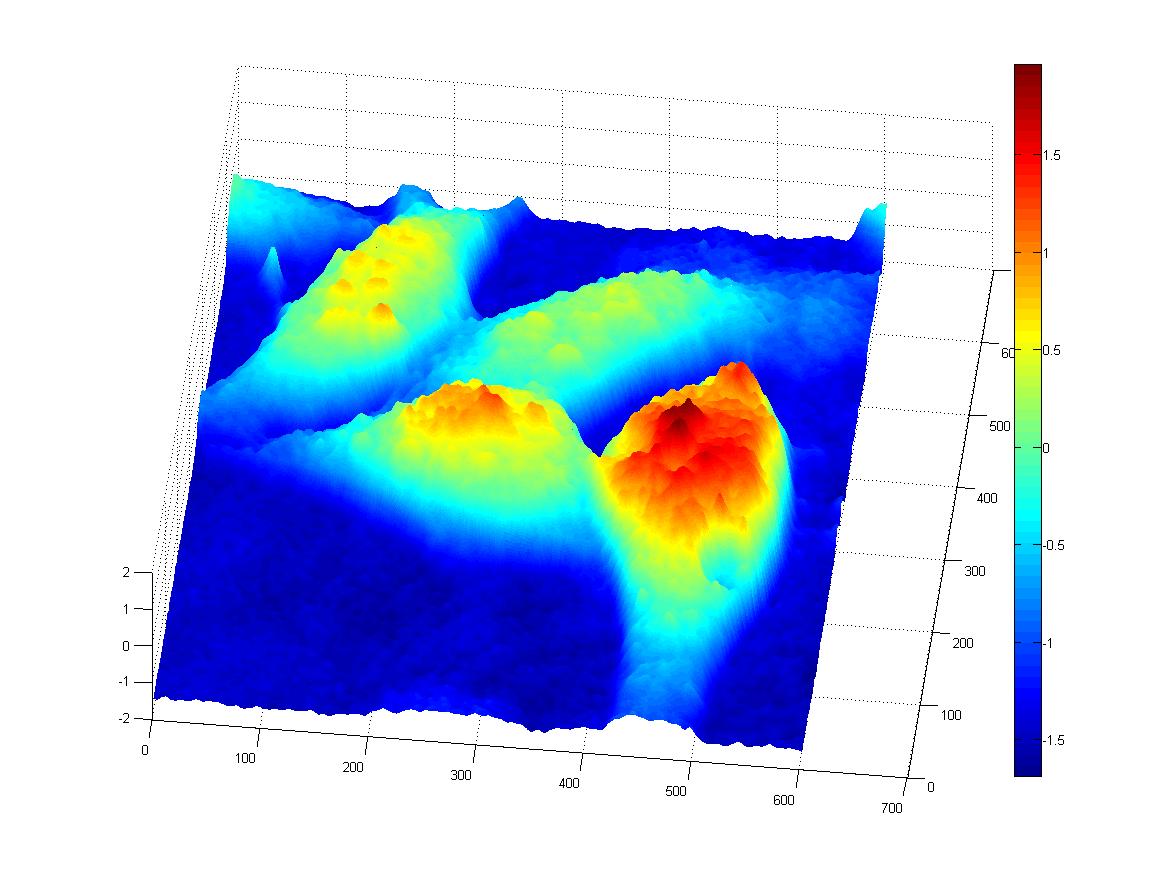
3D rendering of the quantitative phase showing the cellular morphology.
There are several method to retrieve QPM images. We employ here digital holographic microscopy (DHM) based on off-axis holography. This approach is based on interferometry, where the interference between an object beam (passing through the sample) and a reference beam is measured. We then use an off-axis geometry, where an angle is set between the two beams, so that the QPM images can be recovered in one shot.
Digital focusing performed off-line through computer calculations enabling to find the best focus for a given hologram.
The fact of recording an out-of-focus hologram provides the advantage of being able to refocus the phase image off-line after the measurement. Furthermore, the quantitative information can be employed to derive relevant biological information, where the phase signal is mostly correlated with protein content.
DHM employs very low power illumination, making it suitable for long-term observation, where cellular behavior can be monitored over hours or days.
J774 macrophage cells monitored over the course of 1-2 hours for (left) the case of control cells and (right) stimulated cells, that show increased activity..