
High-throughput imaging
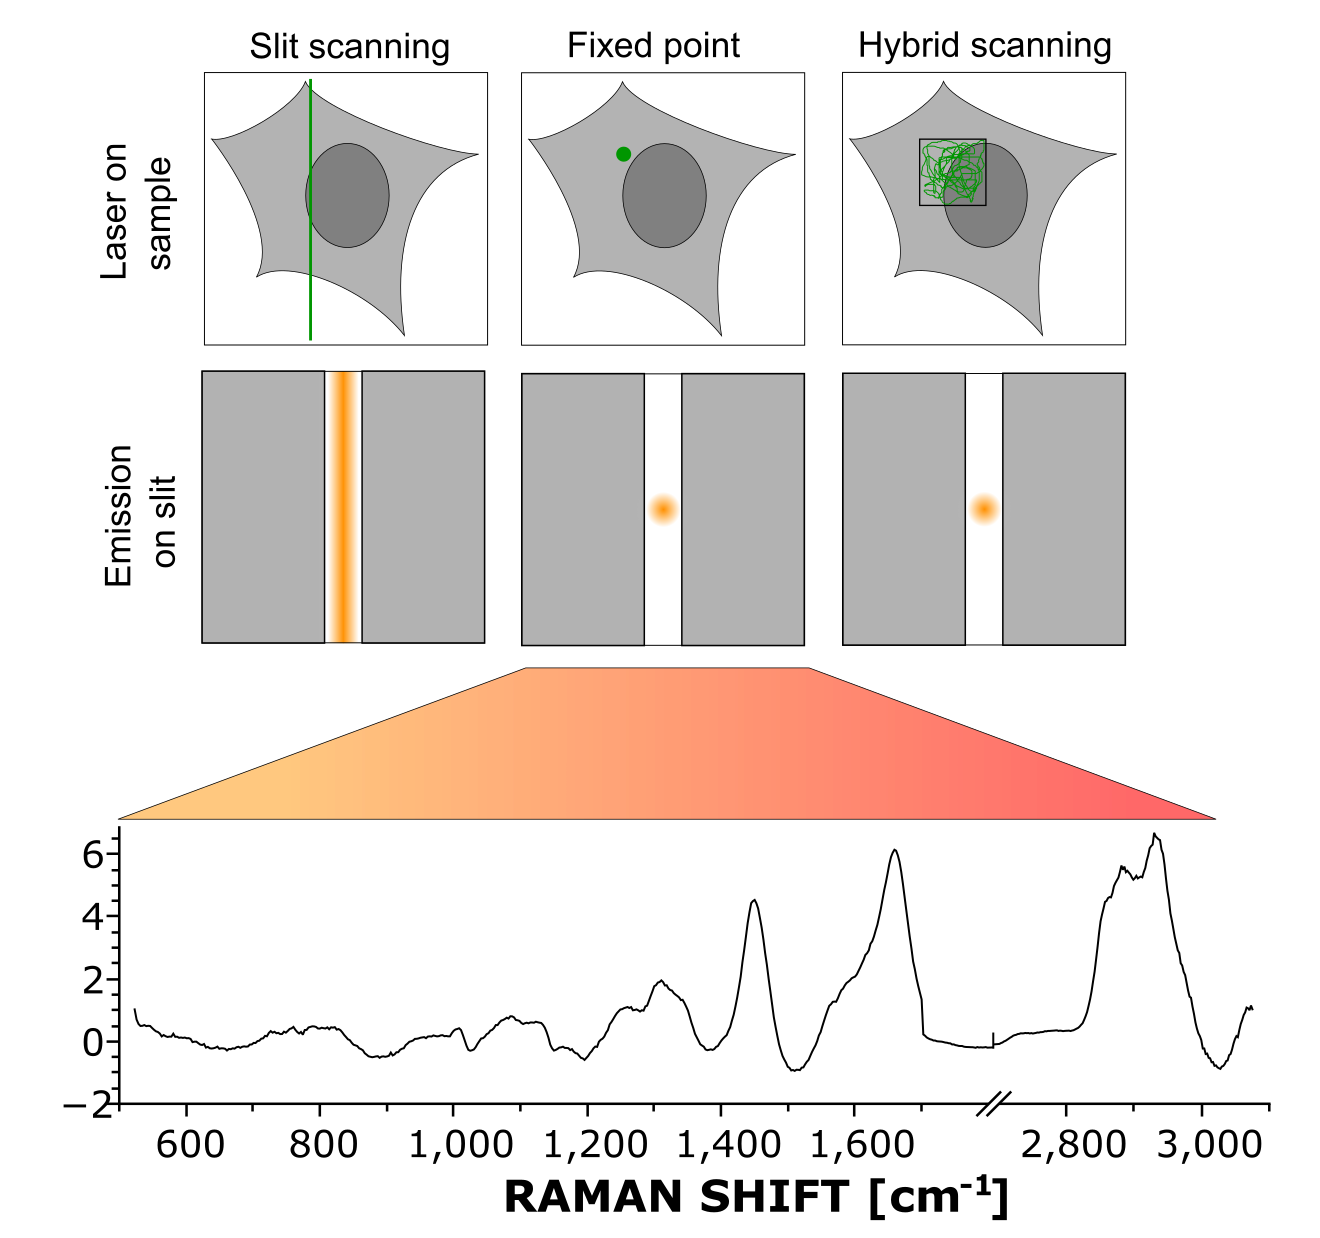
Principle of hybrid scanning, employing random scanning within a region while keeping detection of a point.
Raman spectroscopy is often used to discriminate between cell types such as identifying different cellular species, or detect non-cancerous cells vs. cancer cells. For that purpose, point measurements, where one Raman spectrum per cell is measured, are employed for classification. While this approach ensures the capability of acquiring a sufficiently large amount of data to obtain statistically relevant results for discrimination. However, this method relies on the assumption that one spectrum measured locally is representative of the whole cellular content, which is not necessarily correct as significant spatial contrast can be observed in Raman image.
We developed an acquisition method that ensures that point spectra are representative of the whole cellular content. Imaging measurements spread the excitation over the spectrometer slit to acquire a line. On the contrary, point measurements focus the excitation on one point. In hybrid acquisition, the excitation is randomly scanning within a region of the cell. However, this is performed in the descanned region of the setup, still giving a point at detection, so that the acquired spectrum is effectively an average of the different contributions within that region. The fact of performing this averaging optically during acquisition ensures rapid acquisition of the spectra (compared to a full scan as performed for imaging) and a high signal-to-noise ratio for spectra.
We employ here the multimodal system that we developed to select the region in which to average the Raman signal, where the quantative phase images, acquired at video rate and simultaneous to the Raman spectra, can be directly employed to visualize the cells and select the meaurements regions.
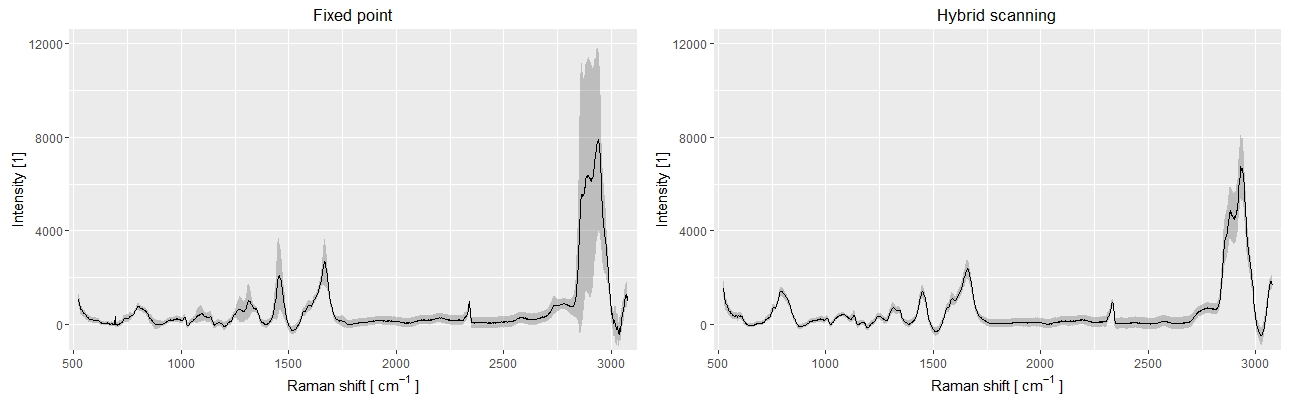
Comparison of the spectral variability between standard point and hybrid scanning, for 100 spectra measured on live cells. The fixed points data (left) displays a much larger variability compared to hybrid scanning (right), where the cell to cell variations can be more easily identified.
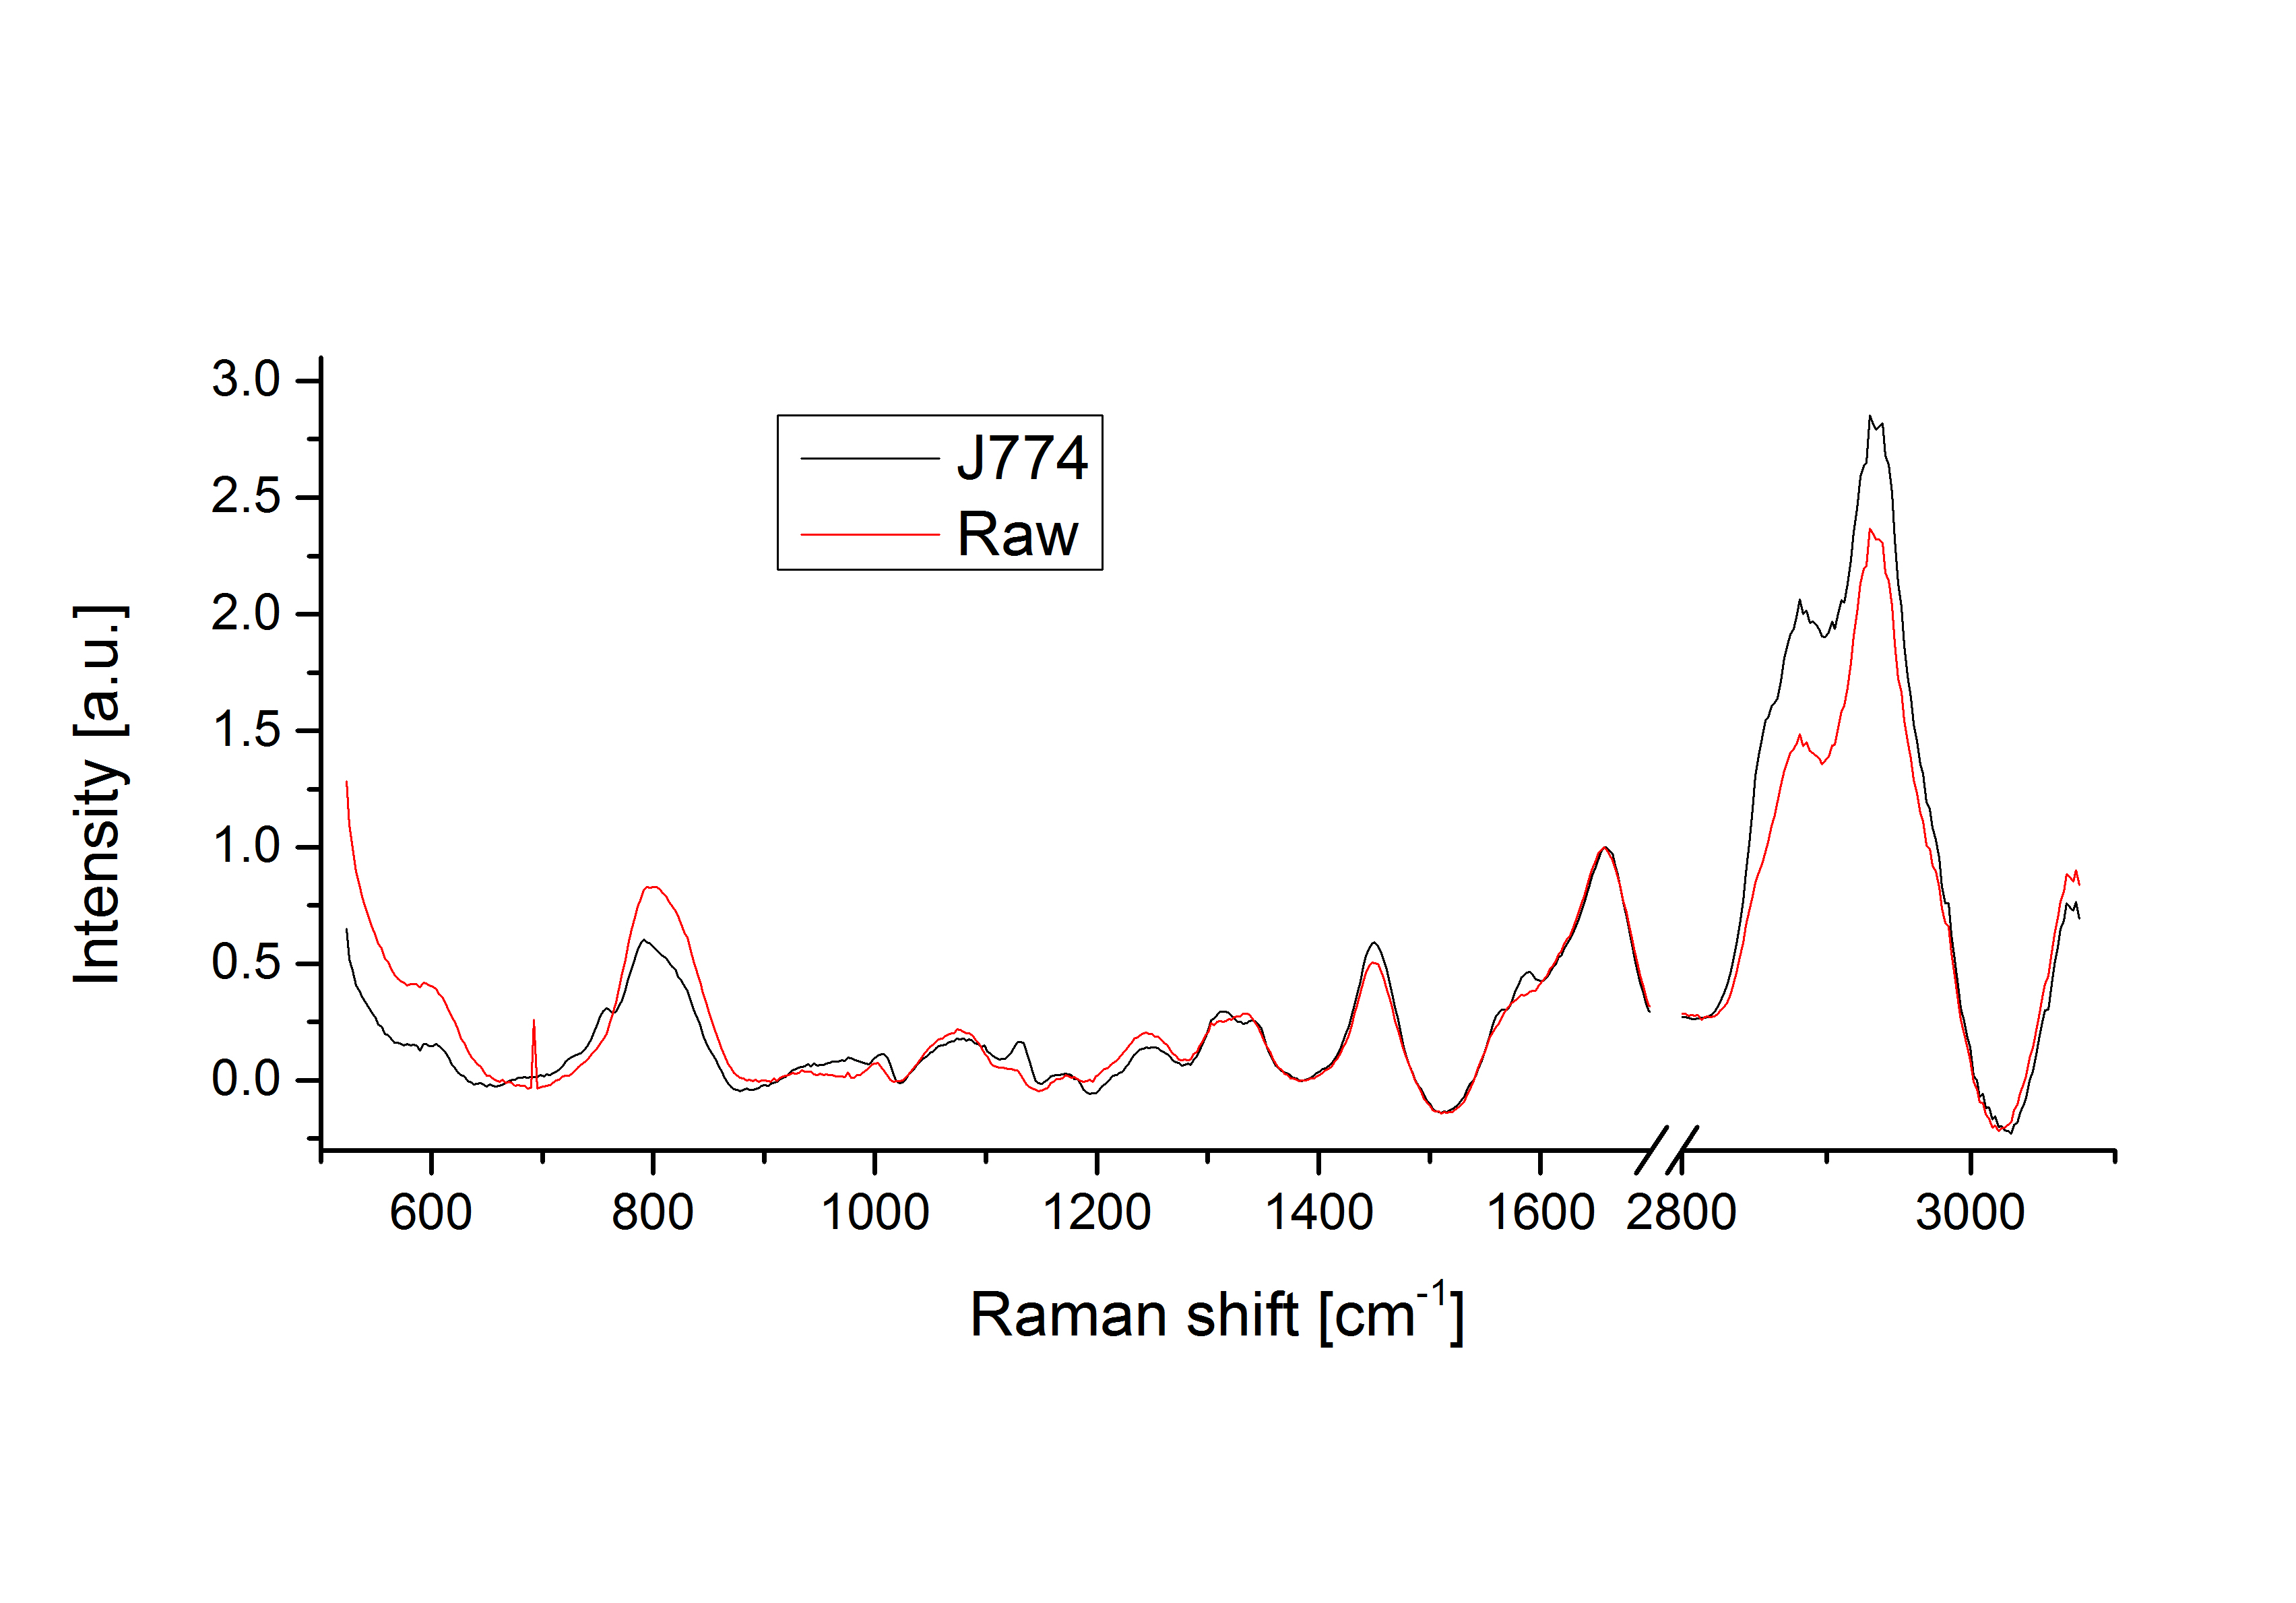
Comparison of J774 and Raw cells spectra, showing fine differences in various regions of the spectrum.
The effect of the local molecular differences in the case of standard point measurements can be observed above, where 100 spectra were measured on live macrophage cells with both standard point acquisition and hybrid scanning. In the case of standard acquisitions, the large variations due to the changes in local content obfuscate the finer cell-to-cell differences. This can be observed when comparing the average spectra of two macrophage cells species such as J774 and Raw264, where only slight changes in specific bands can be identified, which are smaller than the overall variation of standard fixed-point spectra.
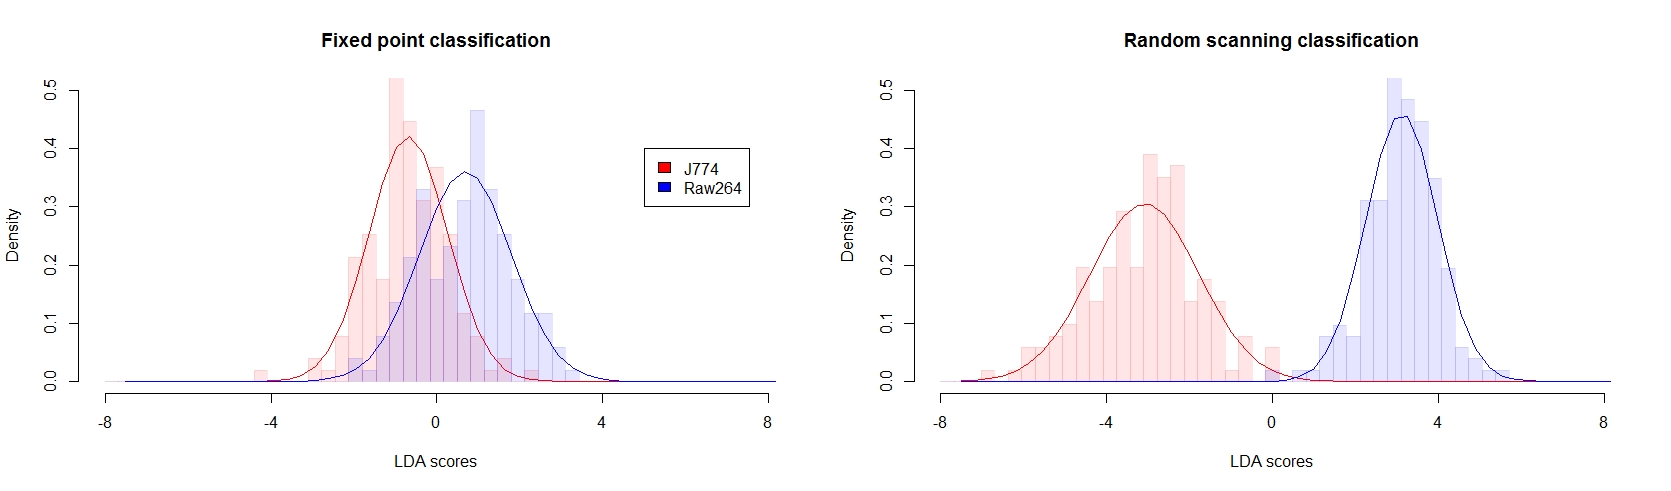
To illustrate the improvement provided by the hybrid measurement approach, we employ data measured on two cell types (J774 and Raw264) to create a model based on the spectral data to predict the cell type on unknown data. This is performed here through linear discriminant analysis (LDA) on a small amount of samples used for training (25%, N = 50), and the model is then applied to the rest of the data (N = 316). Due to the small amount of data available, data reduction based on principal component analysis (PCA) is first computed from the spectra, and LDA is employed on the PCA scores.
As shown below, the hybrid approach provides a much more reliable model with a much more clearer separation, which leads to an overall accuracy of 99.4%. In comparison, the standard fixed point measurements, applied to the same amount of data, only provides 71.8% of accuracy.
| Overall accuracy: 71.8% | ||
| Predicted | ||
| Actual | J774 | Raw |
| J774 | 74.1% | 25.9% |
| Raw | 30.4% | 69.6% |
| Overall accuracy: 99.4% | ||
| Predicted | ||
| Actual | J774 | Raw |
| J774 | 98.7% | 1.3% |
| Raw | 0% | 100% |
Classification based on cell types between two macrophage-like cells lines, where LDA models were generated from either (A) fixed-point and (B) hybrid scanning measurements (N=50) and applied to additional data (N'=316), showing how hybrid scanning data is more reliable for such identification.