
Immune cell activation
We developed a method based on label-free measurement methods developed in our laboratory coupled with machine learning algorithms that enable the detection of fine biological processes such as macrophage cells activation.
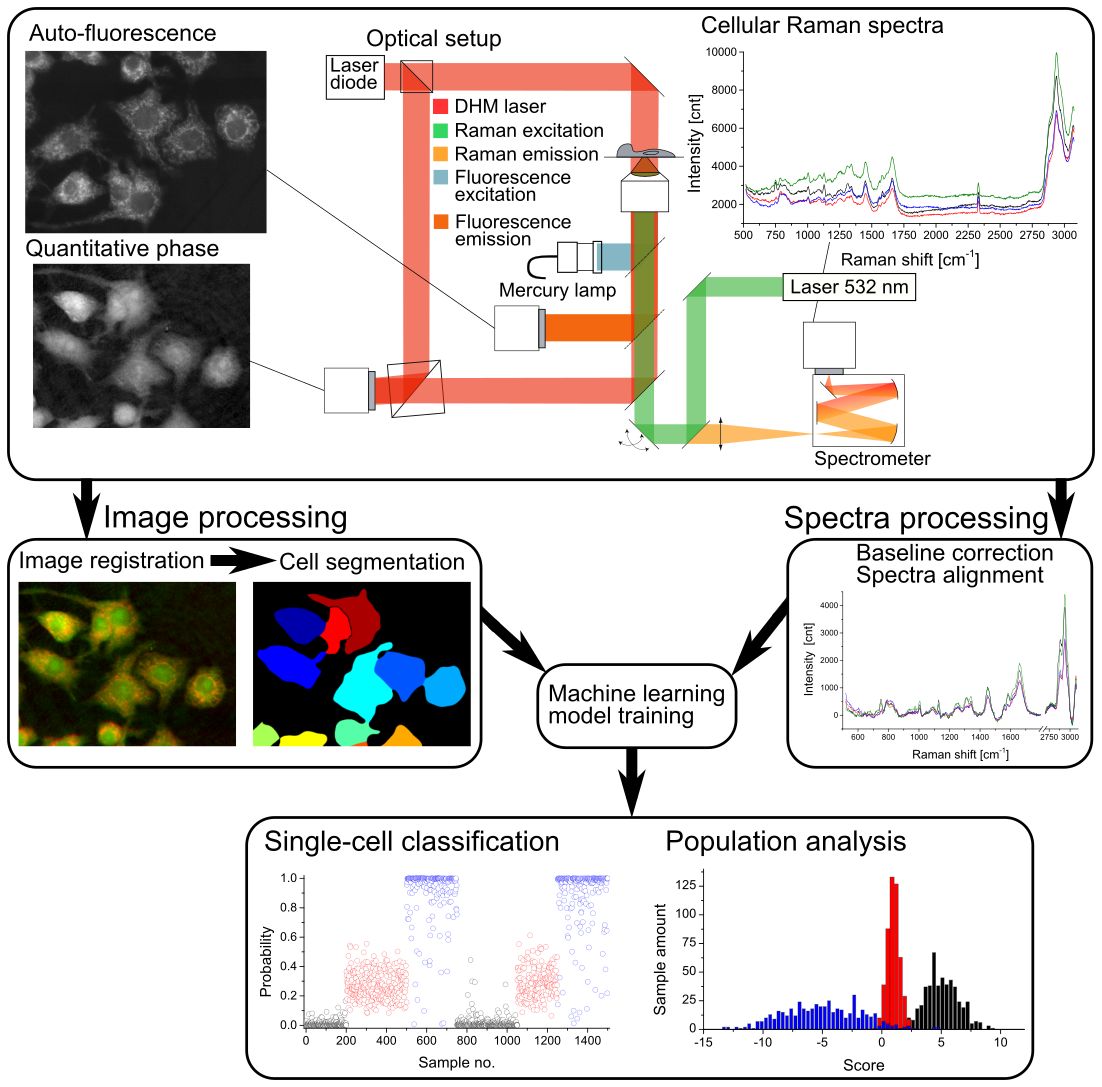
Measurement and data treatment principle, where morphological and spectral
parameters are employed to generate a statistical model that allows for analysis of new cellular data taken in later experiments for classification and scoring.
Method
We combine several measurements in a multimodal system that combines Raman spectroscopy, quantitative phase microscopy (QPM) and autofluorescence. The measurements based on these different modalities are analysed to extract various parameters based on morphology (for instance size, internal structure, etc.) and spectral features, to create a multivariate vector that characterises the state of the probed cells. To further improve the measurement throughput we are employing a hybrid imaging approach for the Raman measurements that allows for faster acquisition while ensuring accurate spectra of the whole cellular content.
Vectors retrieved from cells in known states are first employed to generate a statistical model that enables the identification of cells in sub-populations based on the discrimination criterion, such as resting and activated cells. These models can then be employed to characterise unstained samples measured at different times and in different conditions without further processing. We could show that the models obtained with this approach are reliable over months.
Results
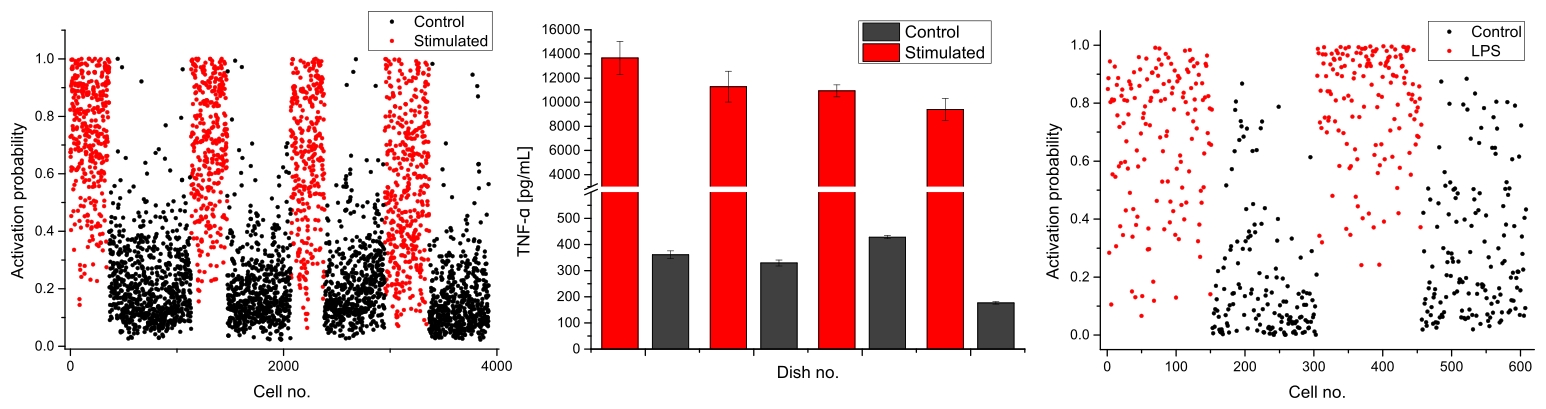
Single-cell activation probability measured with morphological (left, N=3924) and spectral (right, N=608) indicators for a series of control and stimulated preparations. The activation levels are validated at population level by measuring the expression of TNF-α with ELISA within measured dishes (middle), showing good agreement.
Compared to standard assays, this approach makes it possible to analyse samples at single-cell level, where each cell can be assigned an activation probability, and without requiring lengthy staining protocols. We could also show how this approach, based on the overall phenotype and cellular content, can provide more accurate discrimination of cellular activation than immuno-fluorescence assays, that rely on a single molecule to assess the activation level.
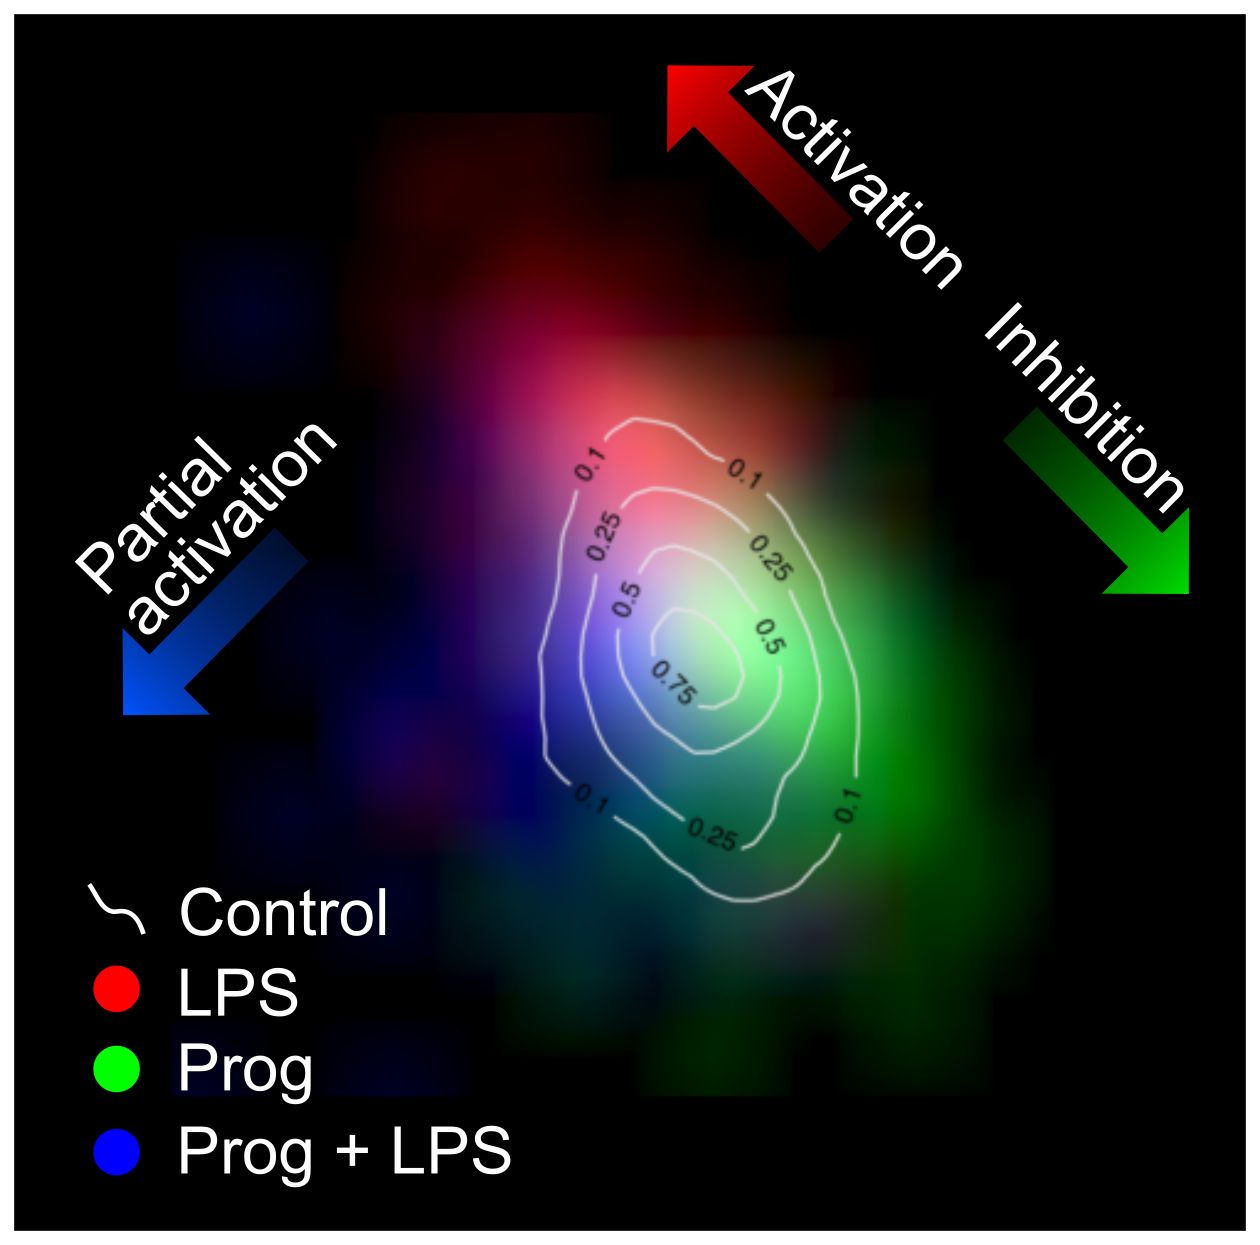
Density maps for cell populations having been exposed to LPS and/or progesterone (Prog), showing the discrimination of resting, activated, inhibited and partially activated cells (N=1741).
We found that both phenotype and molecular parameter sets can detect the activation state, but provide complementary information. The morphology indicators are representative of downstream phenotypes that make the detection dose-dependent, while spectra are indicative of upstream molecular changes. In particular, we could demonstrate that the molecular parameter also enable the detection of partial activation. We assessed the activation level of cells exposed to both a stimulatory molecule (lipopolysaccharide, LPS) and an inhibitory one (progesterone) that is known to selectively down-regulate certain activation pathways. Under these conditions, it was possible to identify sub-populations of all resting, activated, inhibited and partially activated cells, showing that it is possible to detect the intracellular molecular changes that occur upon activation and inhibition, but also in case of selective activation.